Under the umbrella of Working group on Water levels & Waves we defined several subtasks.BMA stands for Bayesian Model Averaging, a method to create a new forecast based on the performance of the various model forecasts in a previous period and to calculate an indication of the spread between those.
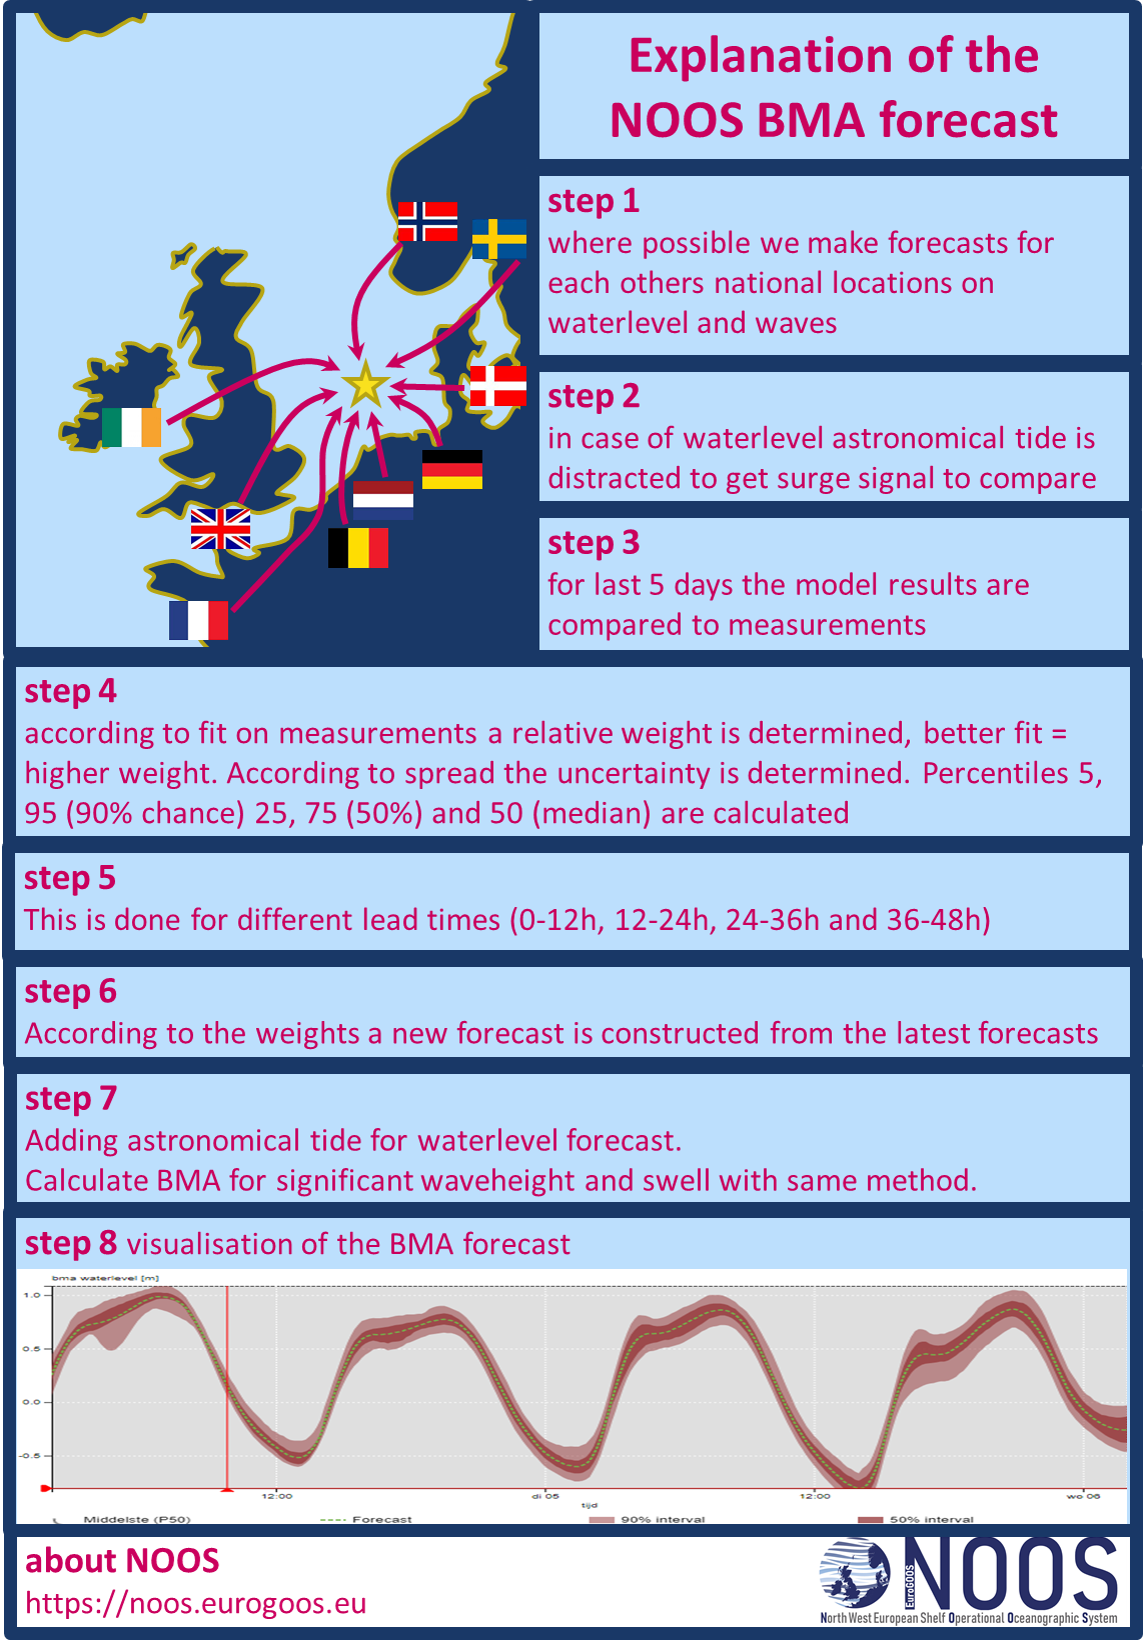
At Rijkswaterstaat this is applied as follows• various North Sea countries make daily forecasts for each other’s locations, 4 to 5 forecasts are required for good BMA results. These are produced and exchanged in a NOOS context, the regional collaboration in EuroGOOS.
• These are tested against the values that have occurred over the past 5 days. 5 is an optimum between sufficient input and a weather situation that corresponds to the next 2 days.
• These forecasts are cut into 4 blocks of a 12-hour forecast lead time. It is possible that one model performs very well in the short term and another model is better further ahead. For that reason we offer both DCSM/Zuno with and without Kalman filter.
• Based on the quality of all forecasts from the past 5 days, that model is given a relative weight per forecast horizon block.
• A bias is allowed because there may be intermediate errors in the model and we want to ignore this in the weighting factors.
• A 90% and 50% probability width is also determined from the variation between the different models
• With the weights thus obtained, a BMA forecast is constructed based on the most recent forecasts.
• The calculation is made on the basis of surge, after which a water level is also determined by adding the astronomical tide to the BMA surge forecast.
• Similarly, the BMA is also applied to Wave and Swell forecasts, albeit still at a limited number of locations.
The BMA is run as a model on the RWsOS system, results are stored in matroos (maps1d: BMA2_waterlevel, BMA2_waves and BMA2_swell and in Series: water level/surge BMA2_fc, _05, _25, _75 _95). And offered to NOOS partners via FTP or the Matroos services.
They are visualized on the new viewer that is framed on https://noos.eurogoos.eu also.See for waterlevel/surge: https://rwsos.rws.nl/viewer/map/noos/waterkwantiteit
And for wave and swell: https://rwsos.rws.nl/viewer/map/noos/golven
Quality
The quality appears to be very good when looking at the statistics. Attached is a PDF with results over two years. Due to lot of migration work on our systems, analysis of quality and tuning of the settings to realize improvements, is still on hold. Another wish would also be to work with only RWS models and see what that yields in relation to prosymfo and DMA.
Points of attention
• The bias option is not always profitable, with persistent easterly winds it even goes wrong, at least in the presentation.
• Bias is also turned on for waves even though there is no reference plane there.
• Returning results to partners now takes place in our reference plane, we actually want to translate back to MSL, therefore we have to receive the supplied data in relation to MSL and use astro in MSL also. Converting this is quite a job that we will only tackle once the basic Matroos is in better order.
• A study by Martin Verlaan indicated that a period of 4 days might yield slightly better results • Expanding locations, such as Antwerp and Southend, is only possible if a substantial number of countries also supply data for those locations and we also have measurements and astronomical tides available.
items of interest
- How does it work in short
- Adding more locations;
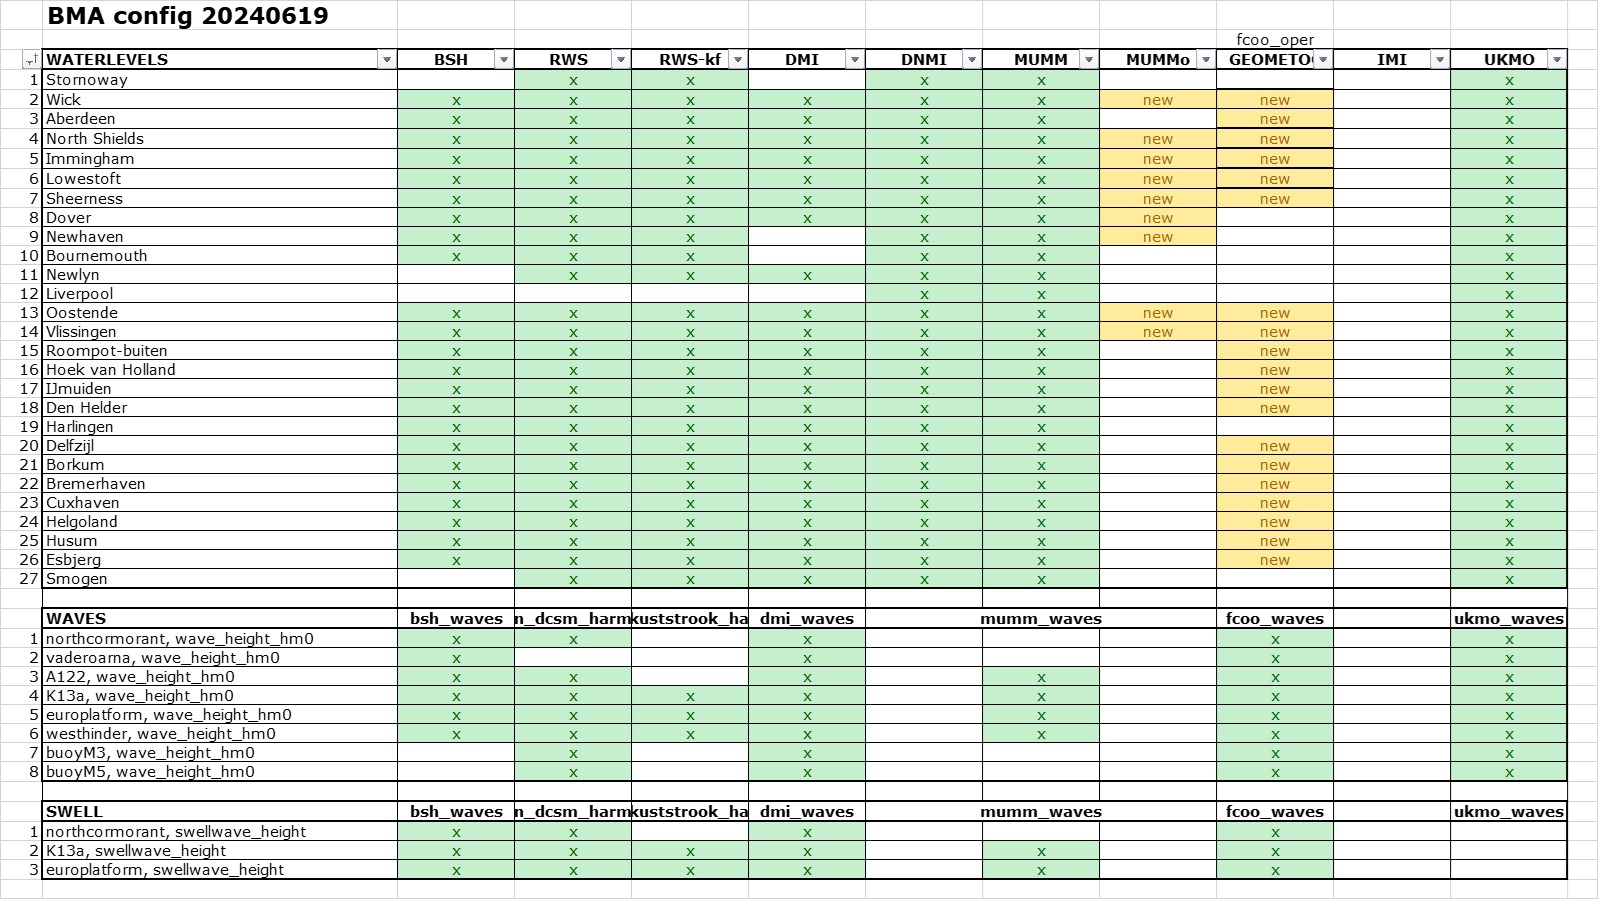
- Actual list of used forecasts:
- Results and operational forecasts